States and territories
Queensland and New South Wales each consumed around a quarter of Australia’s total energy consumption in 2024-25. Western Australia consumed 21.7% and Victoria 20.2%.
In 2024-25, energy use fell in most states. There were small increases in Queensland, New South Wales and Tasmania. This was partly due to increases in residential energy consumption.
| 2024–25 PJ | 2024–25 share (per cent) | 2024–25 growth (per cent) | 10 year average annual growth (per cent) |
|
| New South Walesa | 1,441.2 | 24.5 | 0.4 | -0.3 |
| - of which Australian Capital Territory | 50.4 | 0.9 | -3.4 | na |
| Victoria | 1,183.7 | 20.2 | -3.0 | -1.6 |
| Queensland | 1,438.8 | 24.5 | 0.6 | 0.0 |
| Western Australia | 1,276.5 | 21.7 | -0.2 | 2.0 |
| South Australia | 287.3 | 4.9 | -0.5 | -2.1 |
| Tasmania | 107.3 | 1.8 | 0.1 | 0.2 |
| Northern Territory | 136.9 | 2.3 | -2.1 | 5.0 |
| Australia | 5,871.7 | 100.0 | -0.5 | 0.0 |
Note: New South Wales Includes Australian Capital Territory in main Australian Energy Statistics totals.
Source: Department of Climate Change, Energy, the Environment and Water (2026) Australian Energy Statistics, Table C
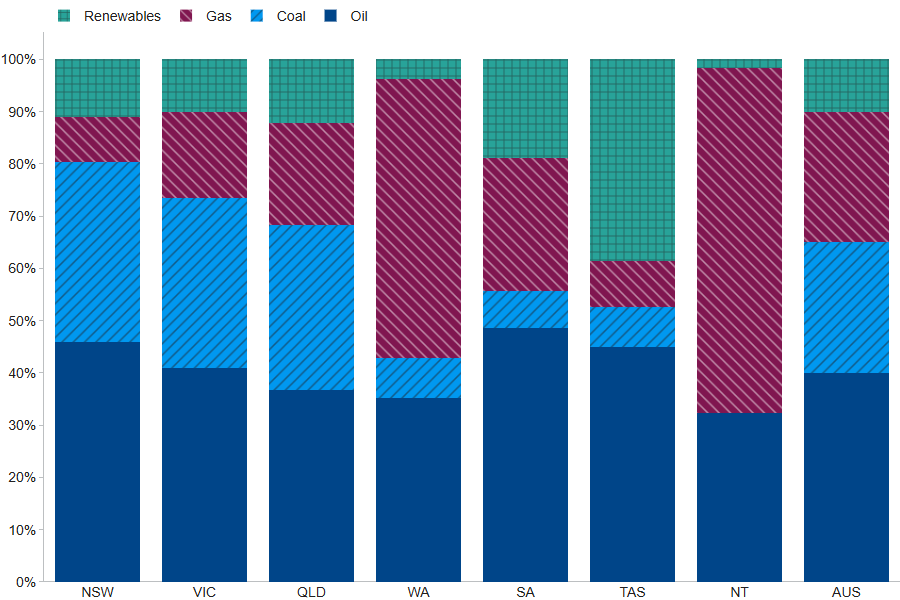
The energy mix varies between states and territories. This is due to differing fuel sources for electricity generation sources and differing industrial activities.
Oil makes up more than one third of energy use in every state and nearly one third in the Northern Territory. This is due to the importance of oil products in transport.
New South Wales’ energy mix contains the largest share of coal, 34.1%. This is because a high percentage of electricity generation comes from coal.
Natural gas makes up two thirds of energy use in Northern Territory. It makes up more than half of energy use in Western Australia. LNG plants in these two jurisdictions consume natural gas to liquefy it for export. The majority of electricity generation also comes from natural gas in these jurisdictions.
More than a third of the energy use in Tasmania (35.2%) is renewable energy, principally hydro power. Renewables also constitute 18.4% of South Australian energy use.
Australian energy mix, by state and territory, 2024-25
Percentage for states and territories. NSW includes Australian Capital Territory